
In my water bill today I received a brochure from WaterAid Australia, asking for help to raise $250,000 per month. The brochure says that WaterAid works to change the lives of millions of ‘people who still lack safe water’. I was thinking about making a donation, when I saw a pie graph that stated for every $1 spent, 80% goes on international programs and advocacy. The graph screamed something at me. It was out of proportion. It was like one of those tricks and puzzles, showing me one thing, when my brain was computing something else.
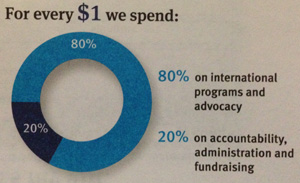 Take a look at this graph. Does it make sense to you? 80% plus 20% equals 100%. That seems correct and logical. Unfortunately, the graph itself was causing me a headache because it just did not add-up in my mind. I simply could not believe that 20% of the pie would be that small. So I scanned it and cut it up in PhotoShop, and re-assembled the graph to show you that it was way out. And that made me suspicious.
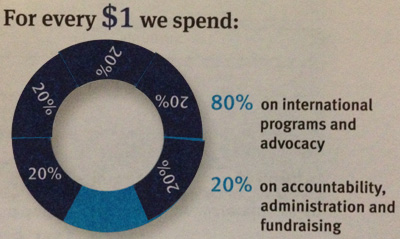 Could I trust a charity that makes such a blunder? Was it a mistake, or was it part of their loose trickery? Did the charity in question (WaterAid Australia) do this on purpose, or did the graphic designer decide to take unwholesome liberties with the truth? As you can see from the image on the right, the error was significant. A whole 20% wedge was added in order to dwarf the size of the 20% spent on ‘accountability, administration and fundraising’.
When I see something that makes me suspicious, I go looking for others. So I began to wonder what the word ‘accountability’ really means. It sounds noble. We all desire accountability. However, we have no idea what kinds of funds are spent in this area. It could be auditing, checking, and supervision. Yet, how can I be sure that it does not include other expenses at which the average person would be alarmed? Does accountability include salaries? What is the total spend on remuneration including bonuses, fringe benefits, corporate cards, expense accounts, company cars, company phones, entertainment budgets etc? Does ‘accountability’ also include people flying around the world to check on sites? If so, why is travel not shown separately, or why is travel part of accountability? What is the travel policy for staff? Or are flights donated as non-cash gifts and donations which are not shown anywhere! Wouldn’t it be great if the public could hover the mouse over each of the line items to see the real details behind what ‘accountability’ really means.
Furthermore, what does the term ‘advocacy’ really mean? Which expenses are tucked away under that term? Is advocacy another name for education, or does it encompass lobbying? Does education sort of mean advertising to the public? If so, is that not a form of fundraising? Indeed, I do not know. And so if I do not know, then which of us would or could know? Why not spell it out? Otherwise, what are we to assume or guess? Then when we read that funds are allocated and sent overseas for ‘international programs’, I would like to know if salaries are part of those funds for overseas staff. So when we are told that money is sent overseas for programs, I want to know if such funds are for salaries, living quarters, phones, meals, etc. I really do not mind what WaterAid does. I am not telling it how it ought to spend its money. They are running the show, and they should be able to do what they think is best. My gripe is not in how they are spending the money, but in them telling me that they like to be transparent, yet I am none-the-wiser. I would feel the fool if I were to part with my money, presuming one thing, when the realities are vastly different. I would also be curious to know why ‘investment income’ has dropped dramatically. What types of investments are they — shares or cash investments? What comprises other income of $38,000?
 I had a look at the WaterAid website and noticed that the charity is big on facts and figures. It has a special page headed, ‘Statistics: The hard facts behind the crisis’. So I started to review some of these ‘hard’ facts and figures. Below we are told that 768 million people don’t have access to safe water. We are told that this is roughly one in ten of the world’s population. According to the US Census Bureau, that puts the statement out by 537,846,977 people [Please see Note A below]. That’s pretty rough to me. More than half a billion people out, from a base of just over 7 billion. On the far right of the image below we are told that 700,000 children die every year from diarrhoea caused by unsafe water and poor sanitation. WaterAid says that’s almost 2,000 children a day. That overstates the problem by 30,000 lives. That’s a lot of human lives. Maybe WaterAid is quoting someone else. However, I feel that it has a duty to consider the level of exaggeration that it is prepared to support, considering that it values ‘hard facts’ and accountability.
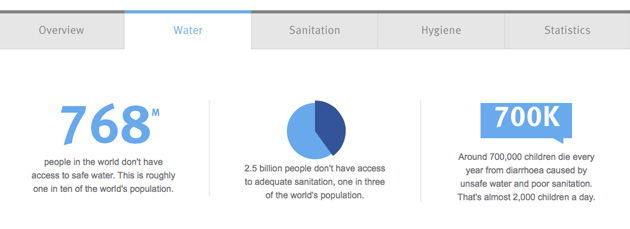
 The pie graph, in the middle of the image shown above, says that one-in-three of the world’s population does not have access to adequate sanitation. Take a closer look at the graph and see if the dark shaded area actually represents one-in-three. So I took their graph, cut it up, and you can see that the shaded area is much larger than it should have been. That is not the kind of graph that ought to be published by a charity that wants me to part with my money. I do not take kindly to that kind of trickery. If it is not trickery, then is it sheer ignorance; in which case, can a charity be trusted if it is so ignorant mathematically? Would that be a clue to financial ignorance as well?
By the way, we can appreciate that fundraising costs money. However, I now wonder what the global standards are when it comes to fundraising ratios. From the table below, we are told that for the year ended 31 March 2013, WaterAid Australia received donations and gifts to the tune of $3,064,000. I would like to know the split between ‘donations’ and ‘gifts’. If it is half-half, then we can assume that the donations were $1,532,000. This would alarm me in view of the expenditure (fundraising costs) shown to be $1,468,000. One would have to presume that spending $1.4 million in order to raise $1.5 million, simply does not make sense. It boils down to a lot of energy and effort, merely to earn $64,000.
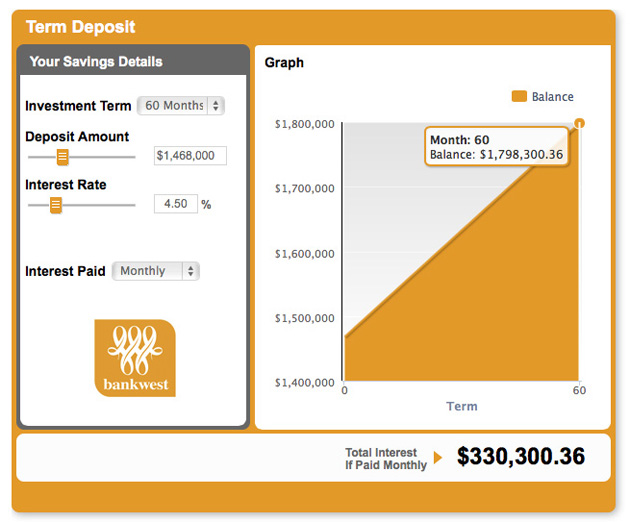
As at 25 January 2014, BankWest was offering 4.50% interest on term deposits, with interest paid monthly. If one were to invest $1,468,000 over 60 months, that would net $330,300.36 in interest with no fees! And it’s secured money in the bank. I imagine for such a large deposit, one could negotiate even better rates with the large institutions. Which would you rather: running around working all year long, paying staff to churn-out numerous events and campaigns to raise $64,000 per year, after risking $1,468,000 in the process; or would you prefer the safety and security of keeping the money in the bank and earning MORE income in interest, than you would in fundraising?
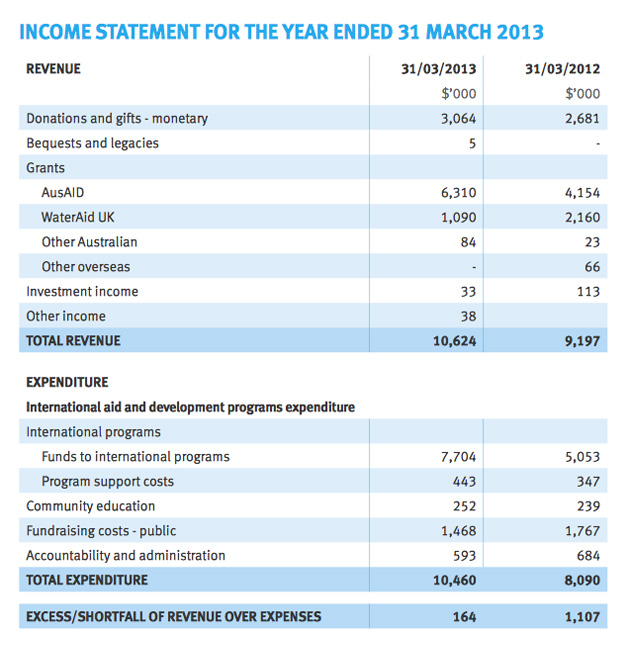
I am further perplexed at the expenditure called ‘Program support costs’ amounting to $443,000. To my mind, that is an expense that I had presumed was covered within the 20% that we are told goes towards ‘accountability, administration and fundraising’. Yet, we see an additional $443,000 on top of the 20%. Which means that the average person who might believe that 20% is the figure, would be surprised to learn that an additional $443,000 is spent on admin and support costs. That does not seem fair to me. If a charity wishes to be transparent, then it has to consider how its statements might be understood or misunderstood by the average person with whom it is communicating. WaterAid itself wrote in one of its reports that it has made a ‘commitment to the Australian public of being a transparent and accountable organisation’.
I AM CONFUSED
 Adding to my irritation are the confusing statements on the WaterAid website. They reference achievements since 1981, yet it says that the charity was established in 2004. If a charity is confident that it is doing a great job, then it ought to boldly state the facts as they really are. Indeed, we have heard about some dubious charities whose unconscionable actions and mismanagement have given the conscientious charities a bad name. The public grows suspicious about who to support, and where the money is going. The best way to combat this kind of resistance is to remain beyond reproach, and always publish the hard facts and the naked truth. Playing funny games with graphs and charts (and trying to enlist creative accounting) only drives a wedge between a charity and its supporters. I wonder if WaterAid’s board members will review this article and summon the management team and explain the kinds of ethics and standards that must be followed. Or will it simply find this kind of article an annoyance, worthy of review by its legal advisers (which reminds me… where do legal and IT costs go? Or is everything pro bono?). It all comes down to the character of an organisation. And like I have always said, the culture and character start at the top.
As I mentioned earlier, I am also confused about the term ‘advocacy’. In the Income Statement, there is reference to ‘education’. So is advocacy the same as education? Who are they educating, about what? Or is this another way of hiding the real costs of fundraising, meetings, conferences, and goodness knows what? How about real transparency in plain English using real mathematics? It seems to me that the whole approach taken by WaterAid is problematic. Facts and figures are precise tools. Therefore, when we are using statistics, there is no need to use words like ‘almost’ and ‘roughly’. Just give us the exact facts and figures. If it is easier to round things up, then my advice is to round things down instead, so that one is erring on the conservative side, rather than the exaggerating (or be seen to be exaggerating) even if one’s intentions were to simplify the communique.
ARE THE TESTIMONIALS VERIFIED?
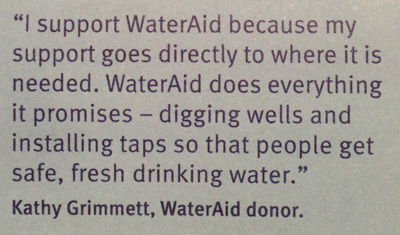 I like truth in advertising. Such truth includes the verification of statements. The brochure that was sent in the mail included a testimonial from a WaterAid donor by the name of Kathy Grimmett who says, ‘I support WaterAid because my support goes directly to where it is needed. WaterAid does everything it promises…’ Indeed, WaterAid might do all those things. WaterAid could be one of the very best charities on the planet. However, does Kathy really know for certain where and how the money is spent? I am not saying that the money is poorly managed. I am saying that in advertising, in my opinion, testimonials need to be verified. Which means that Kathy has no authority and no credibility to make such a statement unless she has 100% proof of each of her statements. Can she be certain of her words, beyond her intuition, gut-feeling, and general presumption? If Kathy has not personally audited and checked that her testimonial is 100% correct, then she should not be making such claims; and WaterAid should not be publishing such unverified testimonials.
I CANNOT UNDERSTAND THESE BAR GRAPHS
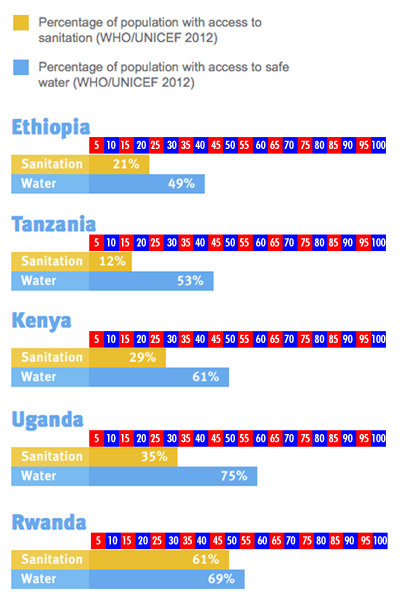 Above, I showed you why I was perplexed by the pie graphs. Now I wish to query how these bar graphs are supposed to work? I found them on the WaterAid website. Am I missing something, or are these bar graphs useless? We are told in the ‘key’ that the data comes from WHO/UNICEF. Presuming that the percentages are correct, how are we to read the bars? For Ethiopia we see 21% sanitation. When does the yellow bar start? From the far left of the whole yellow bar, on which the word ‘Sanitation’ is printed? Or does the yellow bar start after the word ‘Sanitation’? Let’s assume that it is the latter. We now need to visualise what a 100% bar would look like. Using the first bar of 21% as a guide / template / standard, I extrapolated it, all the way to 100% and then I drew the red and navy bar which I manually placed under each country. As you can see, Ethiopia’s 49% bar does not line-up with where 49% ought to be on the red and navy ruler. Uganda’s water at 75% is coming in at 62%. Frankly, to my eyes, it’s a dog’s breakfast. Considering all the other sloppy work, I cannot overlook this as yet another error. There is something unprofessional about these graphs. My caution is rapidly escalating to suspicion. Either that, or someone is taking the public for a ride.
NOTE A
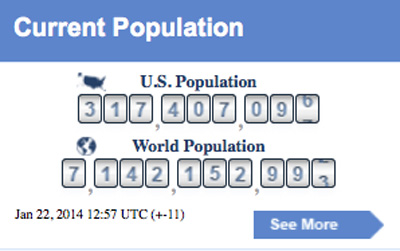 As at 22 January 2014, the date that I inspected the WaterAid site, the US Census Bureau listed the current World Population at 7,142,152,993 people. Using this figure, we arrive at WaterAid’s discrepancy which is outlined above, showing an error rate exceeding 537 million people. Even if we go by what the charity itself might believe the population to be (it indicated on one of its pages that the population is 7.5 billion), that’s still out by 180 million people. Why the irreverent statistics? Imagine if there were an airline crash where the casualties are overestimated by 180 million passengers. Imagine a newspaper accusing a person of stealing $180,000,000 more than the person stole. Why are such error rates tolerable when we are speaking about lives? Perhaps it is permissible to exaggerate if it is for a good cause?
FOOTNOTE
My observations here ought not suggest that I do not acknowledge that people around the world are suffering from lack of improved water and sanitation. It is because I do believe that we need to help our fellow humans, that I want to ensure that we demand excellence (and real/respectful transparency) from those charities whom we entrust/support to run the programs.


Comments are closed.